

HYDERABAD, India

Dr. Reddy’s Laboratories Ltd. (BSE: 500124 | NSE: DRREDDY | NYSE: RDY | NSEIFSC: DRREDDY) today announced its consolidated financial results for the fourth quarter and full year ended March 31, 2023. The information mentioned in this release is on the basis of consolidated financial statements under International Financial Reporting Standards (IFRS).
This press release features multimedia. View the full release here: https://www.businesswire.com/news/home/20230510005650/en/
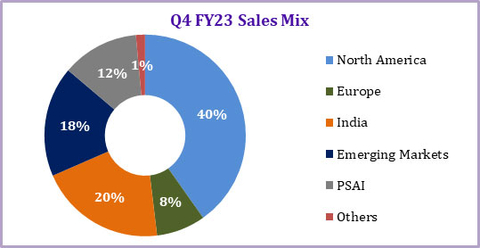
Q4 FY23 Sales Mix (Graphic: Business Wire)
| Q4 Performance Summary | FY23 Performance Summary | |
| Rs. 6,297 Cr | Rs. 24,588 Cr | |
| Revenue | Revenue | |
| [Up: 16% YoY; Down 7% QoQ] | [Up: 15% YoY] | |
|
57.2% |
56.7% |
|
| Gross Margin | Gross Margin | |
| [Q4 FY22: 52.9%; Q3 FY23: 59.2%] | [FY22: 53.1%] | |
| Rs. 1,799 Cr | Rs. 6,803 Cr | |
| SGNA expenses | SGNA expenses | |
| [28.6% of Revenues] | [27.7% of Revenues] | |
| Rs. 537 Cr | Rs. 1,938 Cr | |
| R&D expenses | R&D expenses | |
| [8.5% of Revenues] | [7.9% of Revenues] | |
| Rs. 1,631 Cr | Rs. 7,308 Cr | |
| EBITDA | EBITDA | |
| [25.9% of Revenues; Up: 26% YoY; Down: 17% QoQ] | [29.7% of Revenues; Up: 42% YoY] | |
| Rs. 1,326 Cr* | Rs. 6,037 Cr* | |
| Profit before Tax | Profit before Tax | |
| [Up: 434% YoY; Down: 19% QoQ] | [Up: 87% YoY] | |
| Rs. 959 Cr | Rs. 4,507 Cr | |
| Profit after Tax | Profit after Tax | |
| [Up: 996% YoY; Down: 23% QoQ] | [Up: 91% YoY] | |
|
* Excluding impairments in current & previous periods, Q4 FY 23 PBT is Rs. 1,380 Cr (growth of 38% YoY) and FY 23 PBT is Rs. 6,107 Cr (growth of 53% YoY) |
||
Commenting on the results, Co-Chairman & MD, G V Prasad said: “FY 23 has been a year of record sales, profits and cash flow, driven by our performance in US Generics. We progressed well in our productivity and sustainability agenda. We will continue to deliver on our purpose, invest in growth drivers and promote a culture that is innovative and collaborative ensuring the future of our business.”
All amounts in millions, except EPS. All US dollar amounts based on convenience translation rate of 1 USD = Rs. 82.19
|
Dr. Reddy’s Laboratories Limited and Subsidiaries |
||||||||
|
Consolidated Income Statement |
||||||||
|
Particulars |
Q4 FY23 |
Q4 FY22 |
YoY |
Q3 FY23 |
QoQ |
|||
|
($) |
(Rs.) |
($) |
(Rs.) |
($) |
(Rs.) |
|||
|
Revenues |
766 |
62,968 |
661 |
54,368 |
16 |
824 |
67,700 |
(7) |
|
Cost of Revenues |
328 |
26,971 |
312 |
25,625 |
5 |
336 |
27,607 |
(2) |
|
Gross Profit |
438 |
35,997 |
350 |
28,743 |
25 |
488 |
40,093 |
(10) |
|
Operating Expenses |
|
|
|
|
|
|
|
|
|
Selling, General & Administrative expenses |
219 |
17,992 |
191 |
15,674 |
15 |
219 |
17,981 |
0 |
|
Research and Development expenses |
65 |
5,366 |
53 |
4,326 |
24 |
59 |
4,821 |
11 |
|
Impairment of non-current assets |
7 |
540 |
91 |
7,515 |
(93) |
2 |
134 |
303 |
|
Other operating (income)/expense |
(3) |
(281) |
(4) |
(291) |
(3) |
9 |
732 |
(138) |
|
Results from operating activities |
151 |
12,380 |
18 |
1,519 |
715 |
200 |
16,425 |
(25) |
|
Net finance (income)/expense |
(10) |
(799) |
(10) |
(859) |
(7) |
2 |
139 |
(675) |
|
Share of profit of equity accounted investees |
(1) |
(76) |
(1) |
(105) |
(28) |
(1) |
(60) |
27 |
|
Profit before income tax |
161 |
13,255 |
30 |
2,483 |
434 |
199 |
16,346 |
(19) |
|
Income tax expense |
45 |
3,663 |
20 |
1,608 |
128 |
47 |
3,875 |
(5) |
|
Profit for the period |
117 |
9,592 |
11 |
875 |
996 |
152 |
12,471 |
(23) |
|
|
|
|
|
|
|
|
|
|
|
Diluted Earnings Per Share (EPS) |
0.70 |
57.62 |
0.06 |
5.26 |
995 |
0.91 |
74.95 |
(23) |
|
As % to revenues |
Q4 FY23 |
Q4 FY22 |
Q3 FY23 |
||||
|
Gross Profit |
57.2 |
|
52.9 |
|
|
59.2 |
|
|
SG&A |
28.6 |
|
28.8 |
|
|
26.6 |
|
|
R&D |
8.5 |
|
8.0 |
|
|
7.1 |
|
|
EBITDA |
25.9 |
|
23.9 |
|
|
29.0 |
|
|
PBT |
21.1 |
|
4.6 |
|
|
24.1 |
|
|
PAT |
15.2 |
|
1.6 |
|
|
18.4 |
|
EBITDA Computation |
||||||||
|
Particulars |
Q4 FY23 |
Q4 FY22 |
Q3 FY23 |
|||||
|
($) |
(Rs.) |
($) |
(Rs.) |
($) |
(Rs.) |
|||
|
Profit before Income Tax |
161 |
13,255 |
|
30 |
2,483 |
|
199 |
16,346 |
|
Interest (income) / expense – Net* |
(8) |
(673) |
|
0 |
24 |
|
(1) |
(93) |
|
Depreciation |
27 |
2,213 |
|
25 |
2,039 |
|
27 |
2,245 |
|
Amortization |
12 |
977 |
|
11 |
920 |
|
12 |
1,026 |
|
Impairment |
7 |
540 |
|
91 |
7,515 |
|
2 |
134 |
|
EBITDA |
198 |
16,312 |
|
158 |
12,980 |
|
239 |
19,658 |
|
* Includes income from Investments |
||||||||
All amounts in millions, except EPS. All US dollar amounts based on convenience translation rate of 1 USD = Rs. 82.19
|
Revenue Mix by Segment |
|||||
|
Segment |
Q4 FY23 |
Q4 FY22 |
YoY |
Q3 FY23 |
QoQ |
|
(Rs.) |
(Rs.) |
(Rs.) |
|||
|
Global Generics |
54,257 |
46,118 |
18 |
59,241 |
(8) |
|
North America |
25,321 |
19,971 |
27 |
30,567 |
(17) |
|
Europe |
4,960 |
4,444 |
12 |
4,303 |
15 |
|
India |
12,834 |
9,689 |
32 |
11,274 |
14 |
|
Emerging Markets |
11,142 |
12,013 |
(7) |
13,097 |
(15) |
|
Pharmaceutical Services and Active Ingredients (PSAI) |
7,787 |
7,557 |
3 |
7,758 |
0 |
|
Others |
924 |
693 |
33 |
701 |
32 |
|
Total |
62,968 |
||||

